3D Printing GIS Data
Grades 9-12-
 Art
Art  Math
Math Social Sciences
 Interdisciplinary
INTRODUCTION
One powerful application of 3D printing is the ability to create tangible objects that help students visualize information. Doug McCune has created a utility application shp2stl to convert GIS data in a shapefile format to a three dimensional model suitable for printing.These images were created by Doug McCune from data from the 2014 Napa earthquake:
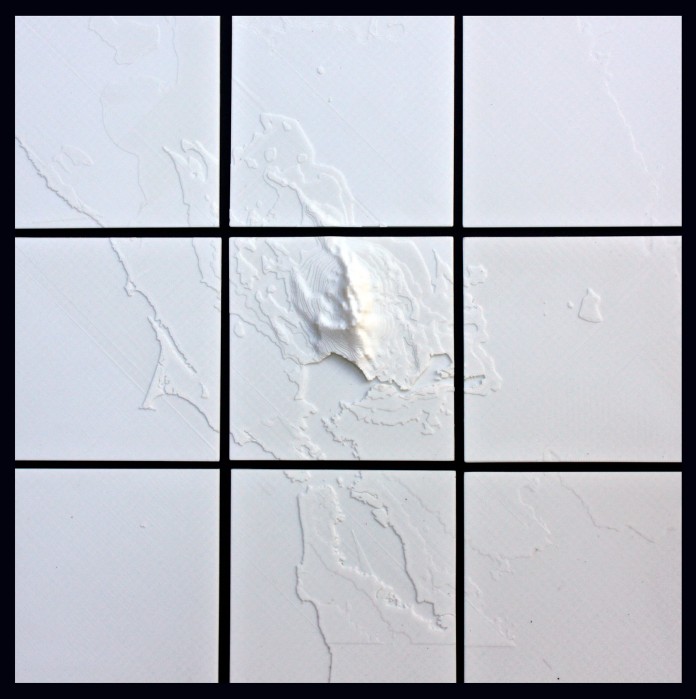
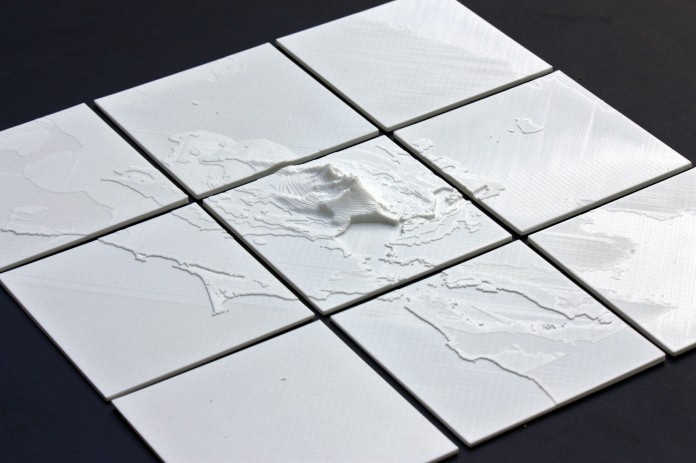

Images from dougmccine.com
GIS
GIS is a computer system capable of assembling, storing, manipulating, and displaying geographically referenced information (that is data identified according to their locations).The primary requirement for the source data is that the locations for the variables are known. Location may be annotated by x,y, and z coordinates of longitude, latitude, and elevation, or by such systems as ZIP codes or highway mile markers. Any variable that can be located spatially can be fed into a GIS. Also, different kinds of data in map form can be entered into a GIS.
Shapefiles
A shapefile stores nontopological geometry and attribute information for the spatial features in a data set. The main file (.shp) contains a fixed-length file header followed by variable-length records. Each variable-length record is made up of a fixed-length record header followed by variable-length record contents. An ESRI shapefile has 3 files:- *.shp (shape)
- *.dbf (table)
- *.shx (index)
After you have your .shp file and your .prj file, you can create a geojson file. You'll need this file to determine how to and if you can extrude your shp file.
Projection files
The .prj file tells you what coordinate system your data is in.Common coordinate systems include:
- Latitude/Longitude - measured in degrees
- UTM (Universal Transverse Mercator) - measured in meters
- Arkansas = Zone 15
- California = Zone 10 or 11
- State Plane - usually measured in feet
- Teale Albers Equal Area (for California) - one coordinate system for the whole state (rather than 2 zones for UTM)
Common datums include:
- WGS 1984 (World)
- NAD 1983 (North American Datum calculated in 1983 - very close to WGS 1984)
- NAD 1927 (North American Datum calculated in 1927 - not as accurate as NAD 1983)
LESSON PURPOSE
- Be able to search for GIS data.
- Be able to understand GIS data.
- Be able to explain GIS data.
- Be able to use GIS data to support an argument.
MATERIALS
- 3D printer
- Access to the internet
- Applications: Node, NetFabb, a Slicer
RESOURCES
- Convert ESRI Shapefile (.shp) to geoJSON (.json)
- convert shapefiles to geojson via web interface
- Defining Coordinate Systems in ArcMap
- QGIS Training Manual
- QGIS Tutorials
- www.digital-geography.com
DATABASES
- www.census.gov
- www.nyc.gov
- olinuris.library.cornell.edu
- catalog.data.gov
- michigan.gov
- huduser.org
- gis.ny.gov
- mapmakerdata.co.uk
- geofabrik.de
- census.gov
- census.gov
- factfinder2.census.gov
- unodc.org
- earthquake.usgs.gov
- water.weather.gov
- data.sfgov.org
- City of Dallas Shapefiles
- nycopendata.tumblr.com
- www.sarahmakesmaps.com
- cta.ornl.gov
- City of Waterbury G.I.S.
STL Generator
Terrain2STL is a web-based application that converts publicly available HGT files (Google Maps) to STL files. You can use the website or download everything from Github and start the server with:node terrainServer.js
A few .HGT files are included, but not the whole set. You can get the rest from the USGS.
The application transforms this:
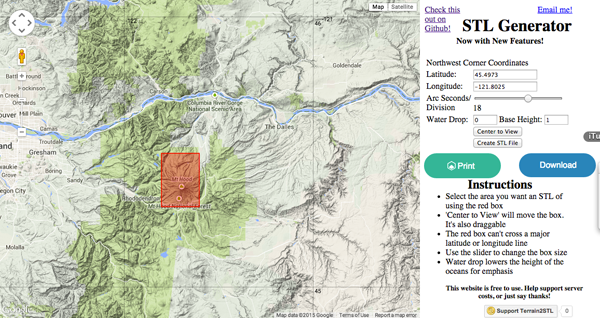
to this:
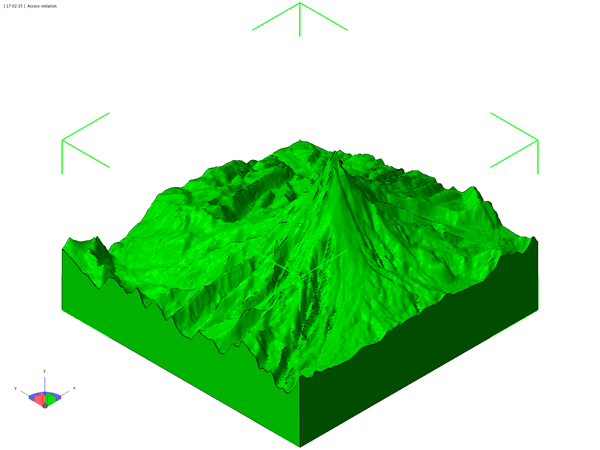 I suggest that before printing, pass the STL file through Netfabb to check for errors.
Node.js® is a platform built on Chrome's JavaScript runtime. It allows you to easily build fast, scalable network applications.
In order to convert shapefiles to geojson files and shapefiles to STL files you will need to have Node.js® installed on your system.
To Install Node.js® navigate to nodejs.org and download and install the appropriate version of Node.js® for your system.
To Install Node.js® navigate to nodejs.org and download and install the appropriate version of Node.js® for your system.
- To test out your installation open terminal on a Mac or Command Prompt on Windows.
- Type: and then press RETURN. You should be presented with the > prompt.
node
- At the prompt type: and press RETURN.
console.log('Hello World');
You should see:Congratulations. Node is working. To exit node press CTRL+c CTRL+c.Hello World undefined >
- Now create a new text document and add this line:
console.log('Hello World'); - Save it as hello.js
- In Terminal or Command Prompt navigate to the directory in which you saved hello.js.
- Then type: If you see Hello World, you successfully wrote your first node program.
node hello.js
Converting .shp to .geojson
A geoJSON file is a plain text file. It is the preferred format of vector geodata on the web, and is a human readable file that will allow you to determine if your shapefile can be transformed into an STL file. The geoJSON format stores geometries and attributes in a standardized manner. It is often used in web applications and Javascript map viewers like OpenLayers and Leaflet.GDAL (Geospatial Data Abstraction Library) is a translator library for raster and vector geospatial data formats that is released under an X/MIT style Open Source license by the Open Source Geospatial Foundation. As a library, it presents a single raster abstract data model and vector abstract data model to the calling application for all supported formats. The library comes with a variety of useful commandline utilities for data translation and processing.
You can install GDAL and use Node.js® to convert shapefiles into geoJSON files yourself or you can use the ogre.adc4gis.com website. The site is an ogr2ogr web client. Ogr2Ogr is a command line tool that converts one Ogr defined data source to another Ogr defined data source. Ogr supports multiple formats: ESRI Shapefile, MapInfo Tab file, TIGER, s57, DGN, CSV, DBF, GML, KML, Interlis, SQLite, ODBC, ESRI GeoDatabase (MDB format), PostGIS/PostgreSQL, MySQL .
Converting locally
Option 1
- Install GDAL
on a Mac
- Go to www.kyngchaos.com and download and install the framework.
- Open Terminal and enter:
echo 'export PATH=/Library/Frameworks/GDAL.framework/Programs:$PATH' >> ~/.bash_profile
source ~/.bash_profile
- Then type:
You should see something similar to GDAL 1.11.0, released 2014/04/16
GDALinfo --version
On Ubuntu
- Install the GDAL-bin package with your package manager.
sudo apt-get install GDAL-bin
-
GDAL applications are run through the terminal. To test your installation, run the terminal command
A correct installation will output something like GDAL 1.11.0, released 2014/04/16.
GDALinfo --version
On Windows
Navigate to trac.osgeo.org and follow the instructions for Windows. - Use npm to install ogr2ogr:
npm install ogr2ogr
- Update npm:
npm install
- In terminal navigate to the directory with your shapefile.
- In order to convert your shapefile you have to know a bit about the data. If your dataset has a .prj file navigate to and upload the .prj file. Prj2EPSG is a simple service for converting well-known text projection information from .prj files into standard EPSG codes.
- When it returns an answer you should get the EPSG number and the CRS number:
Here are the common formats:
4269 - GCS_North_American_1983
EPSG:4269 for CRS:83
EPSG:4326 for CRS:84
EPSG:4267 for CRS:27
EPSG:4030 "Unknown datum based upon the WGS 84 ellipsoid" - Enter the following and use the crs number that was returned:
all file names must be lower case to enable ogr2ogr to do the conversion
ogr2ogr -f GeoJSON -t_srs crs:83 name_of_shp_file.geojson name_of_shp_file.shp
- If you are having trouble converting, another option is to upload your zipped data to converter.mygeodata.eu. The site will convert the data and you can download the results.
- Open the geojson file in a text editor. If your geometry type is polygon you will be able to construct an STL from the shp file, however you will need to access the data to determine if there is some scale you can use to illustrate the data.
Option 2
Another way to convert the file online is HTML5 Shapefile to GeoJSON Converter.Option 3
mapshapper.org is another option that allows you to simplify a shp file and export it as a shapefile, geojson or topojson. You can simplify using the online tool mapshaper.org.- Drop in your shapefile and use the slider to control the simplification.
- When you are happy with your results, click export in the upper right-hand corner and choose Shapefile — polygons.
- Download the two resulting files.
- Next, you want to maintain the properties section populated by data from the Shapefiles. To ensure this section isn't empty, replace your .shp and .shx files with the simplified versions, but don't remove the rest of the files.
- Rename the simplified versions (shp and shx) to match the names of the other files.
QGIS
Sometimes what you want to do is merge multiple Shapefiles or cut out an interesting section. QGIS is a free and Open Source Geographic Information System that allows you to create, edit, visualise, analyze and publish geospatial information on multiple platforms.- Download and install the dependencies and then the Quantum GIS application.
- Add a few plugins. Select Plugins > Manage and Install Plugins.
- Search for MMQGIS and install
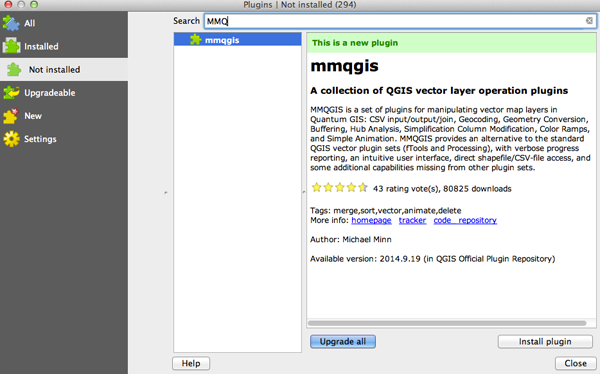
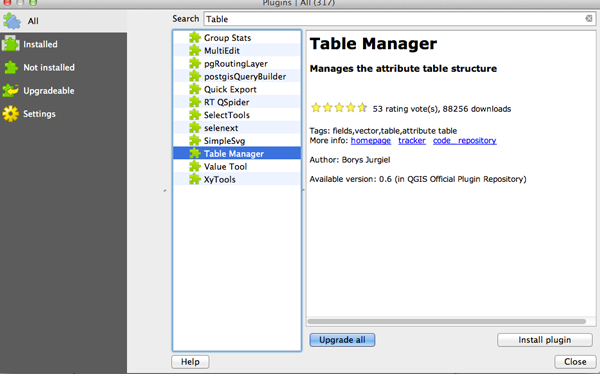
When this plugin is installed on the Mac it will appear as its own menu item - Search for and install Table Manager. This plugin will allow you to edit your attribute fields:
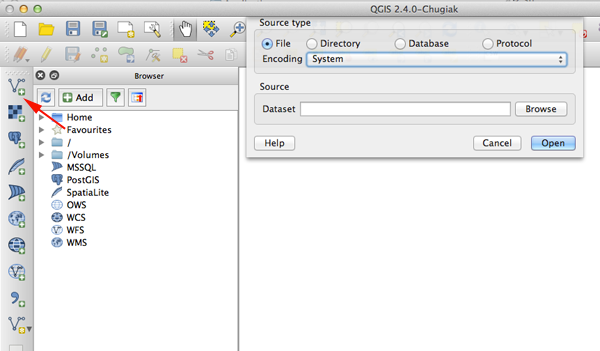
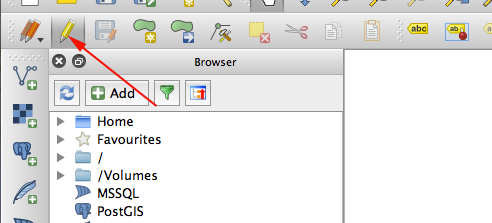
- To open a shapefile select Add Vector Layer:
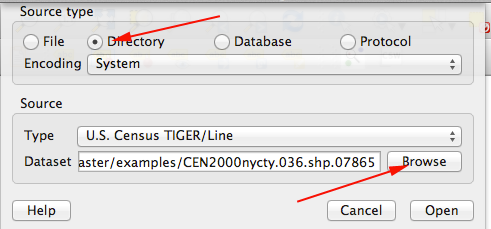
- Click Directory then Browse under Source and select your Shapefile's directory:
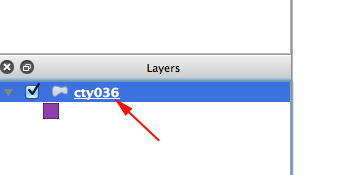
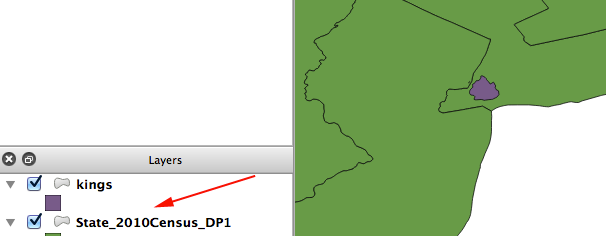
- If the Layers Panel is not visible, select View>Panels>Layer
- Select the Shapefile layer you want to work with:
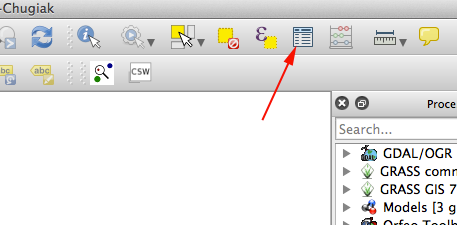
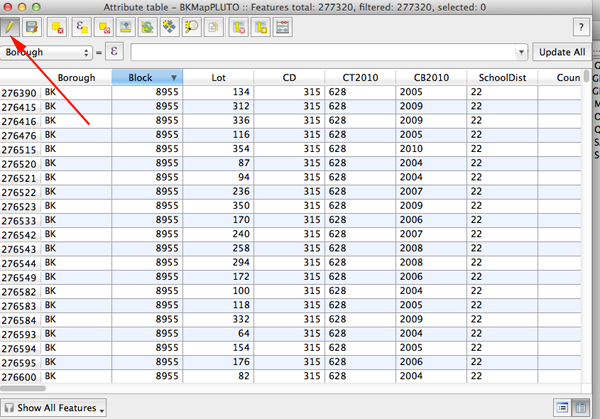
- Open the Attribute Table
- Click on the pencil icon to edit the table
- Click on Delete Column
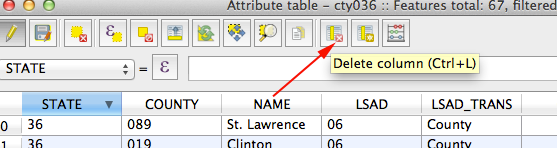
- Select the Fields you want to delete and click OK
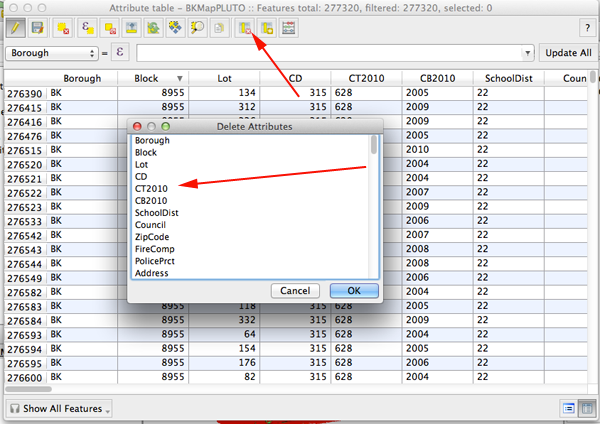
- Close the table.
- Click on the pencil icon to toggle out of edit mode
- To select a feature you want to make another shapefile from click on Select Single Feature
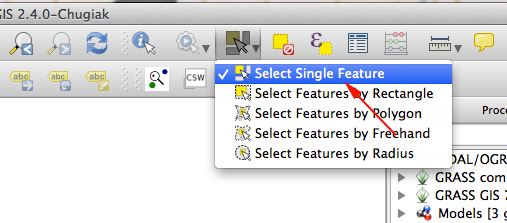
- Then click on an area you want to work with. To Add or remove additional areas, CTRL Click (Windows) of Command Click (Mac)
- Alternatively, you can open the Attribute Table and select the data you are interested in
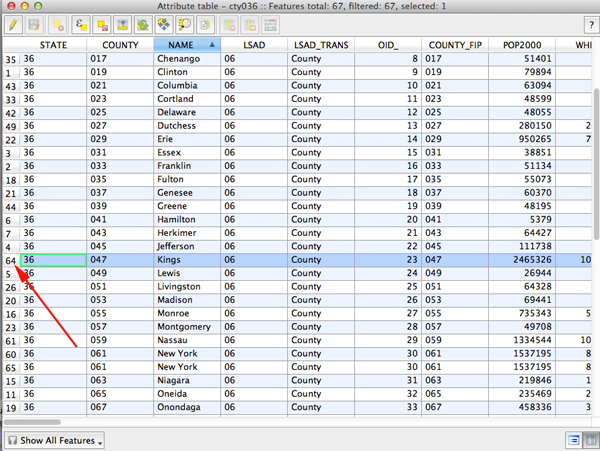
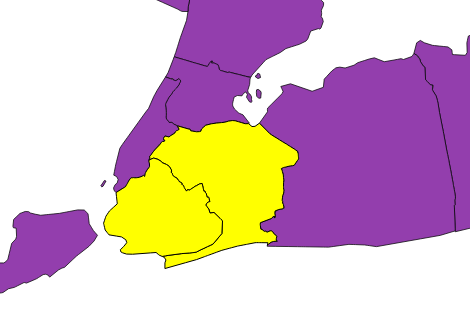
- Another way to find what you are looking for is to use a Query. Select Layer>Query Make your query and press OK
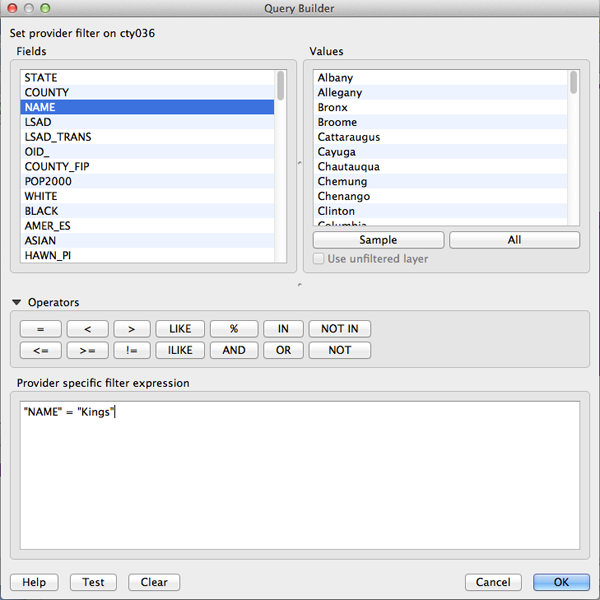
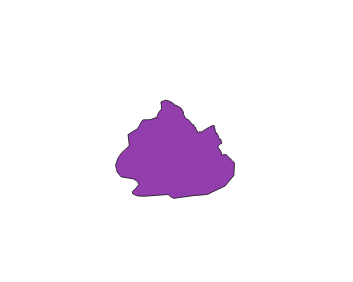
You will be left with only what you queried. To make this a selction click on it:
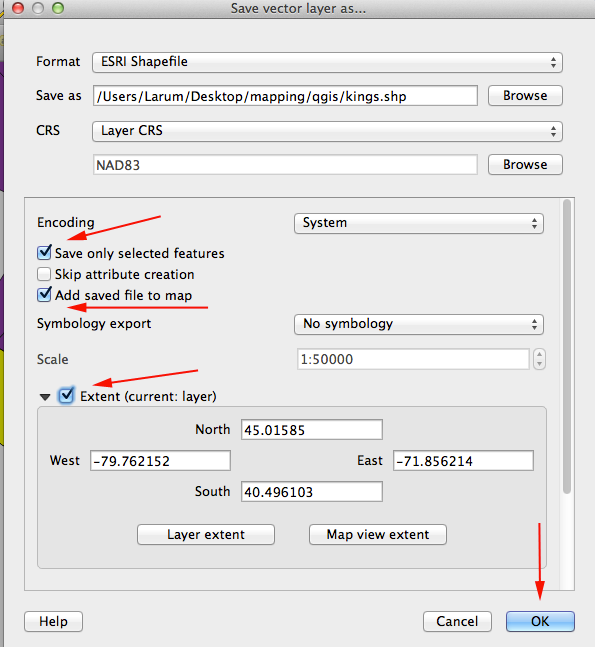
- To save the selection CTRL+click on the shapefile in the Layers Panel and select Save As
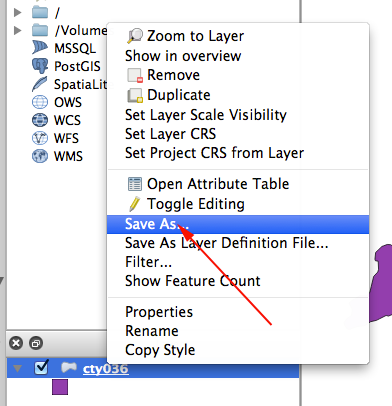
- Click Browse. Navigate to a folder and give the file a name with the shp extension
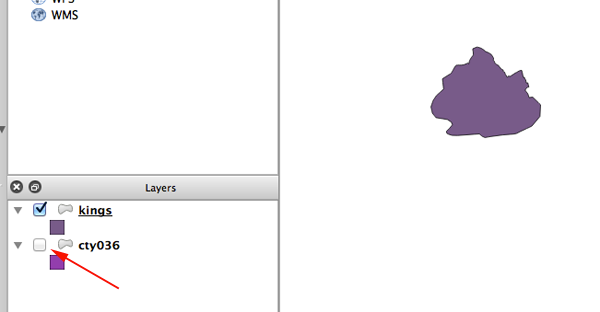
- Save only selected and add the saved file to the map
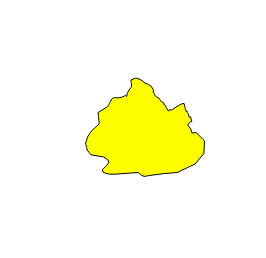
- Toggle the visibility of the original
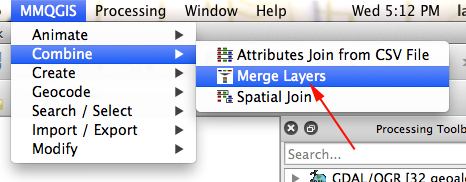
- To merge shapefiles, add another vector Layer
- Order matters. The layers in your Layers list are drawn on the map in a certain order. The layer at the bottom of the list is drawn first, and the layer at the top is drawn last. By changing the order that they are shown on the list, you can change the order they are drawn in.
- Drag the base layer to where you'd like it
- Select MMQGIS>Combine>Merge Layers:
- Select the layers you want to merge
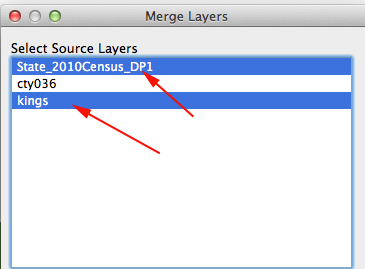
You should have an additional Shapefile with all the geometry from your multiple Shapefiles in one file.
Neighborhood Puzzle (how to use shp2stl)
Zillow has created a database of nearly 7,000 neighborhood boundaries in the largest cities in the U.S. and is sharing it under a Creative Commons license . The neighborhood shapes are available in the Arc Shapefile format and the zipped folder comes with .prj file.- Navigate to Zillow
- Find the state you are interested in and download the zipped file.
- Find out the datum format by processing the .prj file at prj2epsg.org
- Create a geojson file by using the following syntax:
ogr2ogr -f GeoJSON -s_srs CRS:number -t_srs CRS:number file_name.geojson file_name.shp
- Open the geojson file in a text editor.
- Pull out the lines you are interested in using.
In the set below I have pulled out two neighborhoods in Kings county:
Be aware that each entry is separated by a comma, but the last entry must not have a comma:
But if you want to create a puzzle of neighborhoods, you will have to do each element one at a time.
{ "type": "Feature", "properties": { "STATE": "NY", "COUNTY": "Kings", "CITY": "New York City-Brooklyn", "NAME": "Downtown", "REGIONID": 270825.000000 }, "geometry": { "type": "Polygon", "coordinates": [ [ [ -73.991906857264794, 40.689447086272395 ], [ -73.993953193959598, 40.690010607919099 ], [ -73.991014141793102, 40.696236324714199 ], [ -73.991221573637901, 40.698070253586295 ], [ -73.990878931059498, 40.699612144212701 ], [ -73.990479180955802, 40.700289879272596 ], [ -73.990027083373207, 40.700599209197499 ], [ -73.990695501635201, 40.701120415426303 ], [ -73.9892932575234, 40.701272531442299 ], [ -73.986723439684994, 40.7008727820008 ], [ -73.985352870171184, 40.698302964162394 ], [ -73.980651055680681, 40.688701839349001 ], [ -73.984767522774703, 40.690296078027103 ], [ -73.985427789655404, 40.689382486063501 ], [ -73.98671868076309, 40.687535903311897 ], [ -73.991906857264794, 40.689447086272395 ] ] ] } }, { "type": "Feature", "properties": { "STATE": "NY", "COUNTY": "Kings", "CITY": "New York City-Brooklyn", "NAME": "Cobble Hill", "REGIONID": 270816.000000 }, "geometry": { "type": "Polygon", "coordinates": [ [ [ -74.003905940129584, 40.693140987656598 ], [ -74.003875945218994, 40.693185696488598 ], [ -73.999045240149101, 40.691502940543103 ], [ -73.993953193959598, 40.690010607919099 ], [ -73.991906857264794, 40.689447086272395 ], [ -73.994918304110101, 40.683543644197798 ], [ -73.996763382171281, 40.68405237691929 ], [ -74.000634720071403, 40.685119798567897 ], [ -74.002090950179806, 40.685531445314297 ], [ -74.007763636363606, 40.687390909090901 ], [ -74.008525083726795, 40.687635506518802 ], [ -74.007646391920701, 40.688959848513299 ], [ -74.007025952481698, 40.688548191212199 ], [ -74.003963636363594, 40.6931636363636 ], [ -74.003905940129584, 40.693140987656598 ] ] ] } } - Navigate to ogre.adc4gis.com and add the following to the GeoJSON: field in the Convert from GeoJSON form
{"type": "FeatureCollection", "features": [ ] } - Inside the square brackets paste your entries.
- Name the output folder and click Convert to Shapefile.
- Place the shapefile zipped folder in the example folder of the shp2stl folder.
- Open terminal and navigate to your shapefile folder.
- Create a index.js file and save in the folder:
var fs = require('fs'); var shp2stl = require('../../.'); var file = 'OGRGeoJSON.shp'; shp2stl.shp2stl(file, { width: 100, //in STL arbitrary units, but typically 3D printers use mm height: 2, extraBaseHeight: 1, extrudeBy: "REGIONID", simplification: .8, binary: true, cutoutHoles: false, verbose: true, extrusionMode: 'straight' }, function(err, stl) { fs.writeFileSync('OGRGeoJSON.stl', stl); } ); - In terminal:
node index.js
- Run the stl through NetFabb.
- Print the neighborhoods and put them together.
NYC Zip Code Puzzle
The U.S. Postal Service launched the Zoning Improvement Plan (ZIP) Code in 1963 to better handle increasing volumes of mail.The first number in a zip code represents a general geographic area of the nation, 0 in the East, moves to 9 in the West. The next two numbers represent regional areas, and the final two identify the specific Post Office. The lowest number ZIP Code is 00501, a unique ZIP for the Internal Revenue Service in Holtsville, NY. The highest number ZIP Code (99950) is in Ketchikan, AK.
The ZIP+4 Code introduced in 1983 allows mail to be sorted to a specific group of streets or to a high-rise building. In 1991, two more numbers were added so that mail could be sorted directly to a residence or business.
The use of ZIP Codes extends beyond the postal service and has become a fundamental component in the nation's 911 emergency system.
- Navigate to NYSGIS Clearinghouse.
- Click on the Shapefile link and agree to the terms.
- Find out the datum format by processing the .prj file at prj2epsg.org.
- Create a geojson file by using the following syntax:
ogr2ogr -f GeoJSON -s_srs CRS:number -t_srs CRS:number file_name.geojson file_name.shp
- Open the geojson file in a text editor.
- Navigate to the lines you are interested in using.
In the set below I pulled Brooklyn 11201:
{ "type": "Feature", "properties": { "NAME": "Brooklyn", "ST_FIPS": "36", "CTY_FIPS": "000", "POSTAL": "11201", "BUS_FID_Le": 11494.058470, "BUS_FID_Ar": 3687170.336100 }, "geometry": { "type": "Polygon", "coordinates": [ [ [ -75.754367271566721, 52.424269759064764 ], [ -75.75429081561559, 52.42447748945122 ], [ -75.753896007454401, 52.424713642980961 ], [ -75.75379040526505, 52.424880290336461 ], [ -75.752878351337557, 52.425053750781139 ], [ -75.752698126245846, 52.425434911538076 ], [ -75.753312892163919, 52.425548731486771 ], [ -75.752896894671224, 52.426303207662116 ], [ -75.752377203909433, 52.426964437972039 ], [ -75.752184633714393, 52.427097301118472 ], [ -75.751197405351007, 52.428986061892566 ], [ -75.750918153712945, 52.428917024342823 ], [ -75.750754369216523, 52.429053526347424 ], [ -75.750856860152766, 52.429122392294047 ], [ -75.750310319560541, 52.429418629017782 ], [ -75.749841089746894, 52.429445508173778 ], [ -75.749715738849304, 52.429299699599405 ], [ -75.749398117932174, 52.429256108677357 ], [ -75.749109338878711, 52.429534290480547 ], [ -75.748725963823972, 52.429573224830165 ], [ -75.748634530432, 52.429466938798683 ], [ -75.748475327351429, 52.429448564488858 ], [ -75.74841160028015, 52.429462904726698 ], [ -75.748389128266254, 52.429595186493252 ], [ -75.747728924017522, 52.429640631790811 ], [ -75.747710328919609, 52.42969695842352 ], [ -75.746646610483367, 52.429786479863402 ], [ -75.746581009377635, 52.429743402141511 ], [ -75.746298236690379, 52.429785472578125 ], [ -75.746225800645334, 52.42985414147082 ], [ -75.745728393228177, 52.429880385509087 ], [ -75.745129898469315, 52.429872585601949 ], [ -75.745046109946387, 52.42984323768399 ], [ -75.745059254911837, 52.429789122123132 ], [ -75.744786261592225, 52.429769368762337 ], [ -75.745124323327559, 52.429528013761058 ], [ -75.74541427995716, 52.429043223821793 ], [ -75.74542040479561, 52.428902912732063 ], [ -75.745561438321062, 52.428849597686778 ], [ -75.745403454151969, 52.428517468479498 ], [ -75.745568976069464, 52.42847827539287 ], [ -75.74542288765339, 52.428333465792576 ], [ -75.745443834705512, 52.427612163766426 ], [ -75.744324101867889, 52.427593555139062 ], [ -75.744236879141695, 52.427081807025367 ], [ -75.745375363564349, 52.427111043362238 ], [ -75.745280896228181, 52.426737824955381 ], [ -75.744798568929852, 52.426820948144098 ], [ -75.744667648730299, 52.426768693478472 ], [ -75.744523608464505, 52.426778032856561 ], [ -75.744369156012269, 52.426205345473356 ], [ -75.7430172928361, 52.426185612705332 ], [ -75.742960808373709, 52.426089671772694 ], [ -75.742871516142287, 52.426111933088372 ], [ -75.742565039639018, 52.425100487601647 ], [ -75.744932425270193, 52.42512681019376 ], [ -75.744824416594838, 52.424649994853098 ], [ -75.745442712966266, 52.424831244666763 ], [ -75.745409042160617, 52.424789626089073 ], [ -75.745602769020536, 52.424542705378748 ], [ -75.746419847522631, 52.424777281466355 ], [ -75.746564126830336, 52.424592638372175 ], [ -75.74737974988048, 52.424828138080066 ], [ -75.748715678051425, 52.423104331512214 ], [ -75.750438485149772, 52.423603134122018 ], [ -75.75038091397326, 52.423708990499179 ], [ -75.753707284672146, 52.4245098025294 ], [ -75.75391060466734, 52.424305290627082 ], [ -75.754244999001102, 52.423700004871577 ], [ -75.754976439846203, 52.423826488639527 ], [ -75.755320180863421, 52.423707394516697 ], [ -75.755483672283361, 52.423889107584678 ], [ -75.75536063617885, 52.42385276754068 ], [ -75.75507469769147, 52.423936227688934 ], [ -75.754636554901595, 52.42384788683863 ], [ -75.754367271566721, 52.424269759064764 ] ] ] } } - Navigate to ogre.adc4gis.com and add the following to the GeoJSON: field in the Convert from GeoJSON form
{"type": "FeatureCollection", "features": [ ] } - Inside the square brackets paste your entry.
- Name the output folder 11201 and click Convert to Shapefile.
- Place the shapefile zipped folder in the example folder of the shp2stl folder.
- Open terminal and navigate to your shapefile folder.
- Create a index.js file and save in the folder:
var fs = require('fs'); var shp2stl = require('../../.'); var file = 'OGRGeoJSON.shp'; shp2stl.shp2stl(file, { width: 100, //in STL arbitrary units, but typically 3D printers use mm height: 2, extraBaseHeight: 0, extrudeBy: "POSTAL", simplification: .9, binary: true, cutoutHoles: false, verbose: true, extrusionMode: 'straight' }, function(err, stl) { fs.writeFileSync('11201.stl', stl); } ); - In terminal:
node index.js
- Run the STL file through NetFabb.
- Print the zip code areas and put them together.
Data Sets
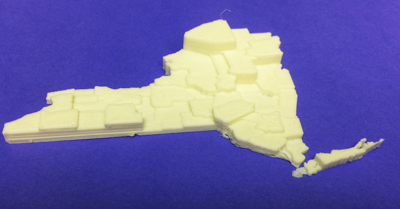
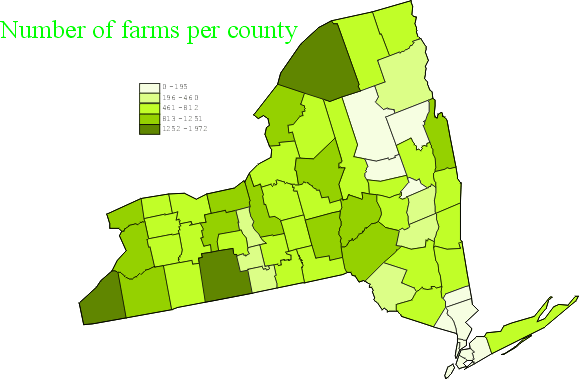
The above maps use the data to tell a similiar story. The data for the 3D version was from the Agriculture Census of the U.S., 1997 and was obtained from CUGIR: Cornell University Geospatial Information Repository
The process of going from data to stl
- The Cornell University Geospatial Information Repository is a great source for New York State shapefiles.
Find a dataset of interest, but be aware that not all shapefiles will work. - If the data has a .prj file navigate to prj2epsg.org and find the datum information.
- Open terminal and navigate to the data folder. Create a geojson file by using the following syntax:
ogr2ogr -f GeoJSON -s_srs CRS:number -t_srs CRS:number file_name.geojson file_name.shp
- Open the geojson file and make sure the geometry is polygon. If it is see if there is an attribute to use to extrude the STL by.
- Move the folder into your stl2shp:examples directory.
- Create an index.js file. For the Agriculture Census:
var fs = require('fs');
var shp2stl = require('../../.');

var file = 'agric_census.shp';

shp2stl.shp2stl(file,
	{
		width: 100, //in STL arbitrary units, but typically 3D printers use mm
		height: 10,
		extraBaseHeight: 0,
		extrudeBy: "AREA",
		simplification: .8,

		binary: true,
		cutoutHoles: false,
		verbose: true,
		extrusionMode: 'straight'
	},
	function(err, stl) {
		fs.writeFileSync('agric_area.stl',  stl);
	}
);
MapPLUTO
MapPLUTO cannot be dealt with in quite the same way as the data above. But this website comes up with a workable solution:Since ogr2ogr can't deal with the projection of this file directly you need to convert the shapefile to a geojson by replacing the content of the .prj with the following projection string:
PROJCS["NAD_1983_StatePlane_New_York_Long_Island_FIPS_3104_Feet",GEOGCS["GCS_North_American_1983",DATUM["D_North_American_1983",SPHEROID["GRS_1980",6378137.0,298.257222101]],PRIMEM["Greenwich",0.0],UNIT["Degree",0.0174532925199433]],PROJECTION["lambert_conformal_conic_2sp"],PARAMETER["False_Easting",984250.0],PARAMETER["False_Northing",0.0],PARAMETER["longitude_of_center",-74.0],PARAMETER["Standard_Parallel_1",40.66666666666666],PARAMETER["Standard_Parallel_2",41.03333333333333],PARAMETER["latitude_of_center",40.16666666666666],UNIT["Foot_US",0.3048006096012192]]
ogr2ogr -f "GeoJSON" -s_srs file_name.prj -t_srs EPSG:4326 -simplify 10 nycneighborhoods.geojson file_name.shp
Neighborhood Tabulation Areas
You can download Neighborhood Tabulation Areas by- typing:
curl -o nynta.zip "https://nycopendata.socrata.com/api/geospatial/cpf4-rkhq?method=export&format=Shapefile"
- Unzip the download.
- replace the contents of the prj file with the following:
PROJCS["NAD_1983_StatePlane_New_York_Long_Island_FIPS_3104_Feet",GEOGCS["GCS_North_American_1983",DATUM["D_North_American_1983",SPHEROID["GRS_1980",6378137.0,298.257222101]],PRIMEM["Greenwich",0.0],UNIT["Degree",0.0174532925199433]],PROJECTION["lambert_conformal_conic_2sp"],PARAMETER["False_Easting",984250.0],PARAMETER["False_Northing",0.0],PARAMETER["longitude_of_center",-74.0],PARAMETER["Standard_Parallel_1",40.66666666666666],PARAMETER["Standard_Parallel_2",41.03333333333333],PARAMETER["latitude_of_center",40.16666666666666],UNIT["Foot_US",0.3048006096012192]]
- Using Terminal navigate to the the unzipped directory.
- In terminal:
ogr2ogr -f "GeoJSON" -s_srs nynta.prj -t_srs EPSG:4326 -simplify 10 nycneighborhoods.geojson nynta.shp
- Look at the geojson and create your index.js file.
ShakeMap
A ShakeMap is a product of the U.S. Geological Survey Earthquake Hazards Program in conjunction with regional seismic network operators. ShakeMap sites provide near-real-time maps of ground motion and shaking intensity following significant earthquakes. These maps are used by federal, state, and local organizations, both public and private, for post-earthquake response and recovery, public and scientific information, as well as for preparedness exercises and disaster planning.- Navigate to earthquake.usgs.gov/earthquakes/
- Select a significant earthquake.
- Click on ShakeMap.
- Click on Downloads.
- Select GIS.
The Shape Files are high-resolution contour polygons of the peak ground motion parameters in ArcGIS shape files.
The three files that come zipped are:- .dbf = A DBase file with layer attributes
- .shp = The file with geographic coordinates
- .shx = An index file
- Move the folder to the examples folder.
- Create an index.js file:
var fs = require('fs'); var shp2stl = require('../../.'); var file = 'pga.shp'; shp2stl.shp2stl(file, { width: 100, //in STL arbitrary units, but typically 3D printers use mm height: 10, extraBaseHeight: 1, extrudeBy: "VALUE", simplification: 0, destSRS: "EPSG:900913", //this requires ogr2ogr command-line tool to already be installed separately on your system binary: true, cutoutHoles: false, verbose: true, extrusionMode: 'straight' }, function(err, stl) { fs.writeFileSync('pga.stl', stl); } ); - Run the STL through NetFabb
- Print.
Workflows
Workflow 1
- Download shp2stl
- Find a data set that you want to work with and save it in a directory inside the example folder.
- Requirements:
- You need your shapemap to be in Polygon format. This means that if the data is in points or lines, you will not be able to create a STL file.
- You need to have something to extrude by. There must be a numeric value in your geojson file that you can use.
- You must have a .prj file
- Navigate to prj2epsg.org. Upload the prj file and convert so that you can find the EPSG code.
- Ideally, you are looking for the following:
EPSG:4269 for CRS:83
EPSG:4326 for CRS:84
EPSG:4267 for CRS:27
If you find that you have:NAD_1983_StatePlane_New_York_Long_Island_FIPS_3104_Feet
Replace the contents of the prj file with the following:PROJCS["NAD_1983_StatePlane_New_York_Long_Island_FIPS_3104_Feet",GEOGCS["GCS_North_American_1983",DATUM["D_North_American_1983",SPHEROID["GRS_1980",6378137.0,298.257222101]],PRIMEM["Greenwich",0.0],UNIT["Degree",0.0174532925199433]],PROJECTION["lambert_conformal_conic_2sp"],PARAMETER["False_Easting",984250.0],PARAMETER["False_Northing",0.0],PARAMETER["longitude_of_center",-74.0],PARAMETER["Standard_Parallel_1",40.66666666666666],PARAMETER["Standard_Parallel_2",41.03333333333333],PARAMETER["latitude_of_center",40.16666666666666],UNIT["Foot_US",0.3048006096012192]]
- Using Terminal navigate to the the unzipped directory.
- In terminal:
ogr2ogr -f "GeoJSON" -s_srs name_of_file.prj -t_srs EPSG:4326 -simplify 10 name_of_file.geojson name_of_file.shp
- Look at the geojson file in a text editor and determine what you will extrude by.
- Create a index.js file in the same directory as your geojson, prj and shp files.
A sample index.js file is as follows. Copy and paste into a text editor and modify to match your data:/* code by Doug McCune*/ var fs = require('fs'); var shp2stl = require('../../.'); var file = 'name_of_file.shp'; shp2stl.shp2stl(file, { width: 100, //in STL arbitrary units, but typically 3D printers use mm height: 10, extraBaseHeight: 1, extrudeBy: "VALUE", simplification: .8, binary: true, cutoutHoles: false, verbose: true, extrusionMode: 'straight' }, function(err, stl) { fs.writeFileSync('name_of_file.stl', stl); } ); - In terminal:
node index.js
- Repair the STL file in NetFabb.
- Print.
Workflow 2
- Find a data set that you want to work with and save it in a directory inside the example folder.
- Requirements:
- You need your shapemap to be in Polygon format. This means that if the data is in points or lines, you will not be able to create a STL file.
- You need to have something to extrude by. There must be a numeric value in your geojson file that you can use.
- Open QGIS.
- Click on Add Vector Layer and navigate to your data directory.(Layer>Add Vector Layer)
- Click on the file in the Layer palette and look at the table. (View>Panel>Layer).
- Use Layer: Query to select part of the data if you don't want all the data. You can also select elements by hand using the Select Single Feature option.
- If you see that you don't have a field to extrude by, you can add a column.
- Click on the Edit Icon, then click on the Open Field Calculator Icon (Ctrl+I).
- Select Create a new field and give the field a name.
- Select the output field type.
- You can use the Conditionals to convert binary information. regexp_match( "PARTY" ,'Republican') will return 1. This works if you just have 2 parties.
- You can also use queries to refine your selection, like only selecting entries where STATE_ABBR='NY'
- >CTRL+click on the Layer and save the selection
- In Table view edit your columns if necessary.
- CTRL+click on the data and save as into the examples folder.
- This process will generate your prj file, even if the original set did not have one. But you don't need it because you can let the table help you pick the field to extrude by.
- A sample index.js file is as follows:
/* code by Doug McCune*/ var fs = require('fs'); var shp2stl = require('../../.'); var file = 'name_of_file.shp'; shp2stl.shp2stl(file, { width: 100, //in STL arbitrary units, but typically 3D printers use mm height: 10, extraBaseHeight: 1, extrudeBy: "VALUE", simplification: .8, binary: true, cutoutHoles: false, verbose: true, extrusionMode: 'straight' }, function(err, stl) { fs.writeFileSync('name_of_file.stl', stl); } ); - Repair the STL file in NetFabb.
- Print.
Shakemap Workflow
- Navigate to earthquake.usgs.gov/earthquakes/
- Select a significant earthquake.
- Click on ShakeMap.
- Click on Downloads.
- Select GIS.
- Create an index.js file:
var fs = require('fs'); var shp2stl = require('../../.'); var file = 'pga.shp'; shp2stl.shp2stl(file, { width: 100, //in STL arbitrary units, but typically 3D printers use mm height: 10, extraBaseHeight: 1, extrudeBy: "VALUE", simplification: 0, destSRS: "EPSG:900913", //this requires ogr2ogr command-line tool to already be installed separately on your system binary: true, cutoutHoles: false, verbose: true, extrusionMode: 'straight' }, function(err, stl) { fs.writeFileSync('pga.stl', stl); } ); - Run the STL through NetFabb
- Print.
